Drug Free Muscle Potential
Jan 1 , 2021 | 4 min read
Jan 1 , 2021 | 4 min read
With the advent of the new year, it is not surprising to see professional athletes developing their new strength and muscle goals. Similarly, relatively normal individuals like us often take the opportunity to move forward with our own fitness goals. However, for anyone more experienced with going to the gym to increase muscle mass and strength, it is common knowledge that with time there is no longer that stark increase in muscle mass and strength that was noticed when they started.
Why would this be so? Could someone be at their peak drug free muscle potential? What is someone's peak drug free muscle potential and how is it calculated? This is what I will try and bring to light in this article. The information in this article is a shorter version of an article by Greg Nuckols. I strongly urge you to check out the article and try using the calculators available to learn more about the technical aspects discussed briefly here.
Drug Free Muscular Potential
One’s drug free muscular potential is the percentage of body mass that the individual can attain on his or her body frame in a conditioned state. Various mathematical calculations can be taken to obtain one's muscular potential body mass. These calculations are simple and take into account some very interesting concepts that control how muscle and bone evolve to develop one's frame.
The Berkhan/Leangains Model
The calculations for this model are as follows:
Weight (kg, in shredded, stage-ready condition) = Height in cm – 100
To find the fat free mass here you would take 95% of the weight as it takes the stage-ready condition
being of 5% body fat percentage. This is a very poor and crude model. We can get into more developed
models further on.
Fat Free Mass Index (FFMI)
This is the most researched model known.
It is calculated as follows:
FFMI = Fat Free Mass (in Kg) / Height^2 (in meters)
To normalize the FFMI and to reduce the influence of height in the calculation we can take
FFMI + 6.1*(1.8m - height (in m) )
A very common notion seen with the research into FFMI is that most drug free natural muscle potentials come
below the ceiling of 25. This is based on a study by Kouri et. al. The study takes 74 nonusers and 83
steroid users and shows that none of the nonusers cross an FFMI of 25 while the steroid users have around
half the users with an FFMI more than 25. Kouri’s investigation goes further to analyse the FFMIs of top pre-steroid era bodybuilders who won the
Mr. America show from 1939 to 1959. The analysis involves various insights.
Hence, the data from 1939 to 1959 was viewed in 2 ways.
The study has its limitations as well. The authors tell us that the upper limit for FFMI = 25 is a
preliminary view due to the presence of many false positives. There can exist some drug users that have an
FFMI that is less than 25. Also, the FFMI value for fatter individuals and thinner individuals is varied.
Adipose tissue consists of different components along with fat - including water, connective tissue,
organelles, vascular networks, etc. There are also known cases of drug free “gifted” individuals with
exceptionally high FFMI.
Muscle to Bone Ratio
This is a technique used in calculating maximum muscle potential and was developed by Francis Holway.
The theme of this strategy is that the amount of muscle one can gain is dependent on how much bone one has.
Biologically this idea is very appealing due to the various indications to the intrinsic linking of muscle
and bone:
The study done investigating muscle to bone ratio claims that the size of someone's skeletal frame is correlated with the amount of muscle mass that they can support. Furthermore, this is supported by knowledge that individuals with more solid skeletal frames are able to gain more muscle and strength in a training programme compared to less solid framed individuals that take up the same training. This study is better than FFMI as taking the bone size not only considers height but also the width and thickness of an individual. This analysis is also seen to produce less false positives when compared to FFMI studies. An upper limit of 5:1 for males and 4:1 for females of the muscle to bone ratio is the general standard for most individuals. The drawback to this, however, is the feasibility of availing the bone mass and muscle mass. This data is difficult to obtain. To cover this drawback we have the last method.
Maximum Muscular Potential Model
Dr. Casey Butt’s analysis proposes a way to get around the problem of feasibility with the muscle to bone
ratio analysis. He found a very strong relationship between wrist circumference, ankle circumference,
and muscular potential. His study explains that wrist breadth is the best discriminator of an association
between frame size and amount of fat and muscle. Wrist breadth contributes information regarding the size
of the upper appendages. This same idea can be extrapolated to the lower appendages with ankle breadth.
You can find the calculator for finding your weight at peak conditioning and at maximum natural muscle
mass with simply your wrist and ankle circumference.
These are some of the best ways to find out one's peak natural muscle weight and muscle capacity.
Of course, none of these are absolutely perfect and there are always rare cases of people overshooting
the maximum prediction.
Clinical Journal of Sport Medicine: October 1995 - p 223-228
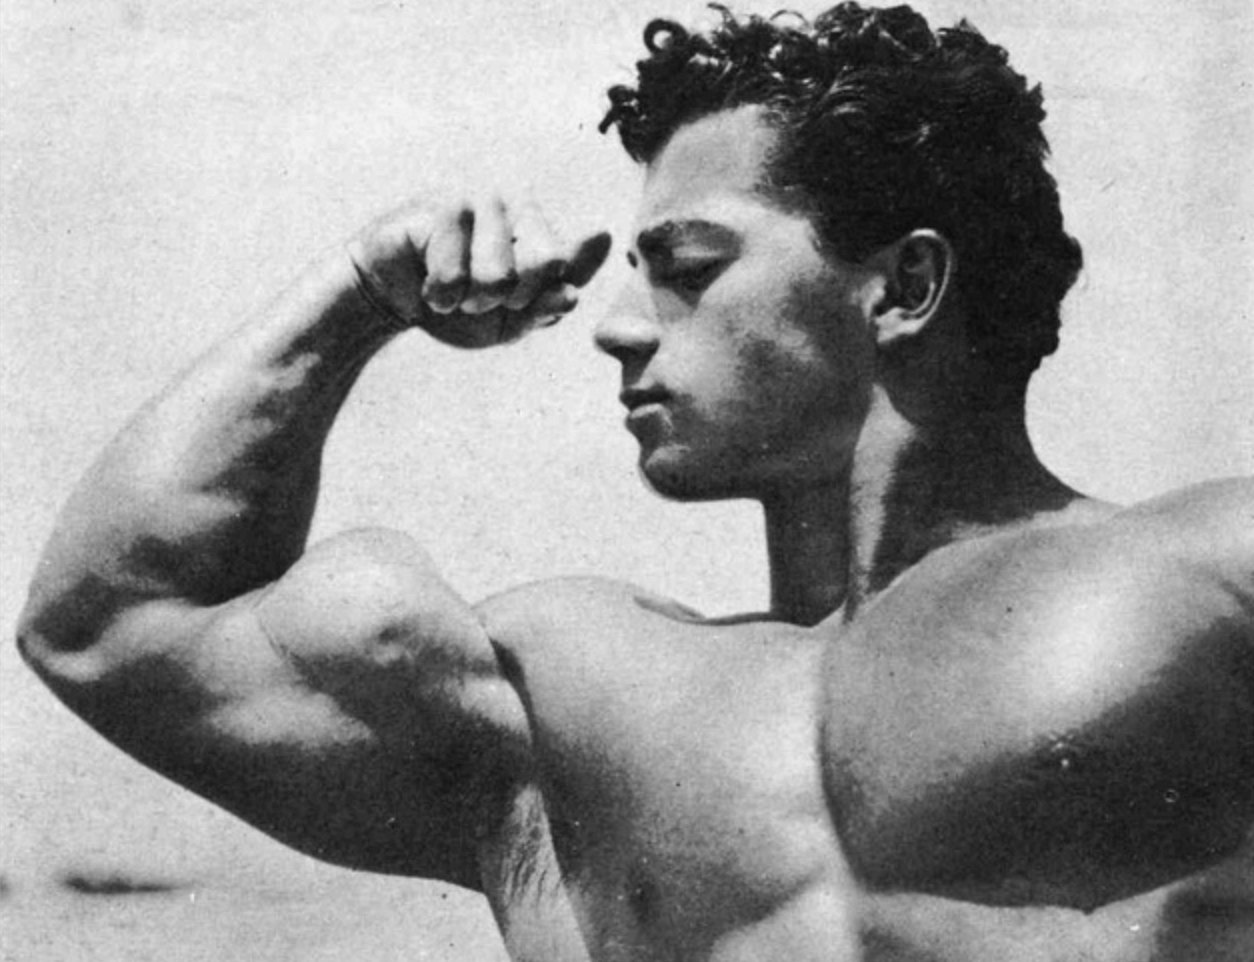
Figure 1. Marvin Eder – a bodybuilder and strength athlete from the early 50s
Dec 10, 2020 | 4 min read

Sep 28, 2020 | 1 min read